Tropical Cyclone Alfred
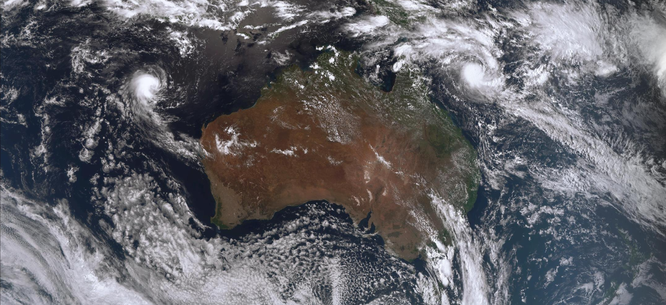
Tropical cyclone Alfred developed in the northern Coral Sea on Monday February 23 2025. Alfred slowly moved south while developing to a servere tropical cyclone then slowed while deteriating to a category 2 cyclone off Brisbane.TC Alfred then crossed over the Moreton Bay Islands and moved north to near Caloundra as a tropical low system. Ex-tropical Afred cossed the Queensland coast on March 8 north of Caloundra.
The name of TC Alfred was used in 2017 for a tropical cyclone in the Gulf of Carpentaria. Read more about the first TC Alfred.

Severe Tropical Cyclone Alfred was a long-lived Coral Sea event that had a major impact over southeastern Queensland and northeastern New South Wales including widespread coastal erosion, damaging winds causing widespread power outages and some structural damage, and widespread heavy rainfall and associated flooding.

A low formed northeast of Cooktown on 21 February and moved generally eastwards over the following days. Conditions were favourable for development and Tropical Cyclone Alfred was named at 4 pm AEST 23 February. Alfred turned to the south on 25 February and continued to intensify.
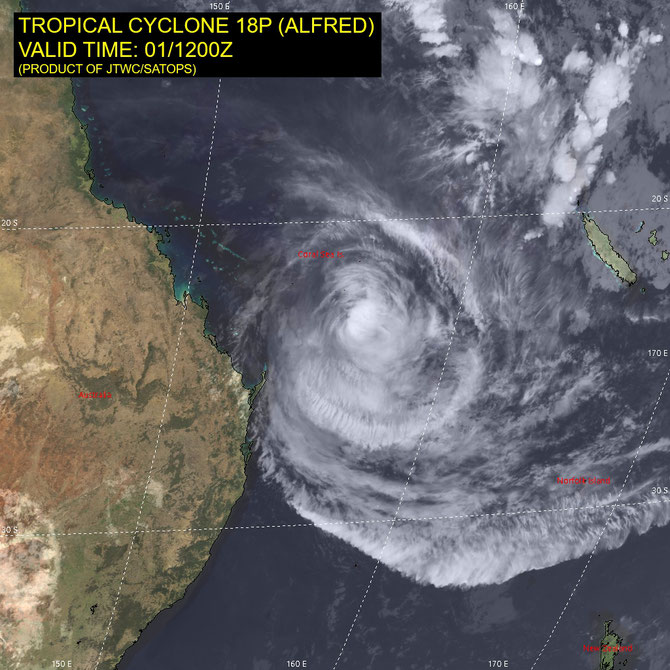
Alfred first reached its lifetime peak intensity at 4 pm AEST 27 February while well offshore of the Queensland coast, with maximum 10-minute mean winds estimated to be 165 km/h (category 4). During 27-28 February Alfred fluctuated in intensity, weakening slightly to category 3 before re-intensifying back to its peak (category 4) intensity . From 1 March, conditions became unfavourable and Alfred began to weaken, reaching category 1 intensity by 4 pm AEST 2 March while well east of Rockhampton.
Between 2-4 March, Alfred was steered to the southeast and again fluctuated in intensity, this time between category 1 and category 2. During 4 March Alfred turned abruptly to move westwards towards the Queensland coast. Steering influences were weak, and Alfred displayed slow and sometimes erratic motion as it gradually moved west towards the southeast Queensland coast. Alfred was downgraded to category 1 as it approached the Moreton Bay Islands. The motion was very slow westwards, and the system moved across Moreton Island around 1 am AEST 8 March before being downgraded to a low at 6 am AEST 8 March just east of Bribie Island. The low then stalled over the water for most of the day before finally crossing Bribie Island (north of Brisbane) around 8 pm AEST 8 March, and moving west onto the mainland at 9pm AEST 8 March.
Alfred caused significant damage to southeast Queensland and northeastern New South Wales through damaging wind gusts, heavy rainfall with subsequent flooding impacts and severe coastal erosion of beaches.
Some of the wind gusts recorded over southeast Queensland and northeastern New South Wales across the event.
Date Location Wind gust Time (AEST)
7 March Cape Byron AWS* 120 km/h (65 knots)** 5:09 am
Gold Coast Seaway 107 km/h (58 knots)** 9:46 pm
Coolangatta 100 km/h (54 knots)** 1:43 am
Gold Coast Airport 100 km/h (54 knots) 1:43 am
Evans Head RAAF Bombing Range AWS 100 km/h (54 knots) 8:11 am
Brisbane Airport 93 km/h (50 knots) 11:16 pm
8 March Redcliffe 104 km/h (56 knots) 9:24 pm
Cape Moreton Lighthouse 102 km/h (55 knots) 11:46 pm
9 March Cape Moreton Lighthouse 109 km/h (59 knots) 12:52 am
Toowoomba Airport 98 km/h (53 knots) 1:20 am
*Not at Bureau standard measuring equipment height
**Highest daily wind gust record for March.
Heavy rainfall was recorded for a prolonged period over northeastern NSW and southeast Queensland. Highest 7-day totals to 9am AEST 10 March were 1146 mm at Upper Springbrook (Qld) and 1048.4 mm at Lower Springbrook (Qld). 7-day totals exceeding 800 mm were reported at other Gold Coast sites and in New South Wales in the Northern Rivers district and along the Clarence River above Dorrigo and in Mullumbimby in Brunswick River.
Riverine flooding and flash flooding was recorded in northeastern NSW and the Gold Coast initially and then extended further north. On Sunday 9 March riverine flooding or severe flash flooding occurred from as far north as Hervey Bay (Wide Bay) south to northeastern New South Wales. Hervey Bay recorded 189.0 mm in 2 hours (4.50 to 6.50 am). Many areas in the Sunshine Coast area were inundated, including Nambour which reported an annual highest daily rainfall record of 365 mm in the 24 hours to 9 am 10 March. Heavy rain commenced around the Brisbane region Sunday 9 March resulting in extensive riverine flooding or flash flooding . The official Brisbane gauge recorded an annual daily record of 275.2 mm for the current site . This is the highest daily rainfall Brisbane City has recorded, at either the current site or old site, since 26 January 1974 with Cyclone Wanda, when 314mm was recorded***. On Monday 10 March heavy rain became more isolated and extended to inland areas with the remnants of Alfred.
Widespread minor to major riverine flooding occurred in northeastern NSW and southeastern QLD. In NSW, major riverine flooding occurred in the Richmond, Clarence and Bellinger Rivers while in QLD, major riverine flooding occurred in the Lockyer, Laidley and Warrill Creeks, Bremer, Logan and Albert Rivers. Significant localised flash flooding also occurred in many locations.
Seven-day rainfall totals to 10 March (all highest 7-day rainfall records for March).
Location Rainfall total (mm)
Upper Springbrook Alert 1146.0
Lower Springbrook Alert 1048.4
Dorrigo (NSW) 894.0
Mullumbimby (NSW) 856.0
Binna Burra 719.0
O'Reillys 714.0
Tweed Heads Golf Club 670.6
Mount Tamborine 658.6
Some notable 24-hour rainfall totals (Qld unless stated).
Location Rainfall total (mm) Date Comments
Meldrum (Clarence R., NSW) 235.0 6 March
Dorrigo (Bielsdown Creek, NSW) 224.0 6 March
Meldrum (Clarence R., NSW) 228.0 7 March
Upper Springbrook Alert 280.0 8 March
Dorrigo No 2&3 (NSW) 264.5 8 March
K'gari Eurong 427.3 9 March Annual daily record.
Mt Glorious Alert 322.0 9 March Daily record for March.
Upper Springbrook Alert 276.0 9 March
Hervey Bay 261.4 9 March Annual daily record.
Diamond Valley (Maroochy R.) 433.0 10 March
Nambour 345.0 10 March
Brisbane 275.2 10 March Annual daily record for site 40913. Highest since 314mm 26 Jan. 1974.
Bilambil Heights (NSW) 274.0 10 March
Archerfield 272.6 10 March Highest March daily rainfall.
Eagle Farm 244.0 10 March Highest March daily rainfall.
Amberley 162.4 10 March Highest March daily rainfall.
Gympie Alert 147.0 11 March
*** Observations for "Brisbane City" are taken from the current site Brisbane (40913), which opened December 1999. Rainfall is compared across the current and former site Brisbane Regional Office (40214) which ran from 1841 to 1994 with complete daily rainfall data from 1869.
More than 500 000 customers were without power over southeast Queensland and northeastern New South Wales with many remaining without power for multiple days. Power outages were generally attributed to the windy conditions, including trees or tree branches falling onto power lines.
The slow passage of Alfred southwards parallel to the Queensland coast produced large easterly swell that impacted the coastline of southeast Queensland and northeastern New South Wales causing significant coastal erosion. It is estimated that millions of cubic metres of sand were scoured from beaches leaving escarpments up to 6 metres high in some dunes during the prolonged event. Sites recorded significant wave heights of between 3 and 5 m along the Sunshine Coast. Further south from Brisbane to the northeastern New South Wales coast, significant wave heights of 5-8 m were observed. Large maximum wave heights were recorded offshore at Tweed Heads, Brisbane, and Coffs Harbour.
Wave heights
Location Significant wave height Maximum wave height
Tweed Heads Offshore 7.9 m, 0200 AEST 7 March 15.24 m, 1100 AEST 5 March
Tweed Heads 5.76 m, 0730 AEST 6 March 10.05 m, 0730 AEST 6 March
Coffs Harbour 6.8 m, 1300 AEDT 5 March 12.6 m, 2200 AEDT 5 March
Tropical Cyclone Alfred was the seventh tropical cyclone in the Australian region during the 2024/25 season.
**All information relating to intensity and track is preliminary information based on operational estimates and subject to change following post analysis.**
From www.bom.gov.au